Visualize the SEO investment vs. ROI curve 📈
2 things for you: A free SEO tool to extract headings from SERP + an illustration to visualize the SEO investment vs. ROI curve
Hey👋, Rafiqul from AccrueSERP (SEO agency that delivers business growth, not just traffic).
In this newsletter episode, I have TWO things to share with you:
A free Google Colab script (must have to create content outlines)
An illustration that will help you win SEO clients
1. Google Colab Script to extract headings
This Google Colab script extracts the H1, H2, H3, and H4 headings of the top 10 search results for your keyword in a chosen country, and lets you download the data as a CSV file.
Prerequisites
Create a free account with SearchAPI to obtain an API key.
Access the Google Colab script via the provided link: https://colab.research.google.com/drive/1xIe-AHR-5T7AsNB2MxG26n4Gau_Px8hj?usp=sharing
Here’s the step-by-step process to extract headings
Step 1: Copy the Script
Open the Google Colab link and make a copy in your drive.
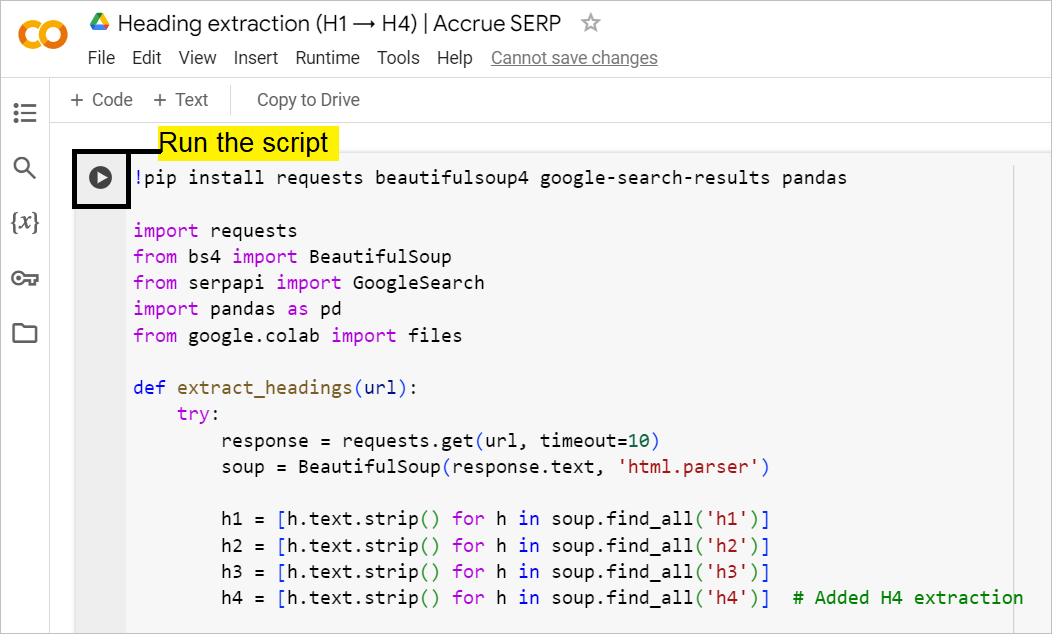
Step 2: Run the script in Google Colab
Run the first cell to install the required libraries.
Once the required library is installed, you will be asked to enter your SERP API key code.
Step 3: Enter Your API Key
Go to your dashboard in SERP API.
Copy the API key code
In the next cell, enter your SerpAPI key in Google Colab.
Step 4: Input Your Keyword and select the country
When prompted, enter the keyword you want to analyze and the country code corresponding to your target audience (e.g., ‘us’ for the United States).
Step 5: Process the Search Results
The script will retrieve your keyword and country’s top 10 search results.
It will extract the H1, H2, and H3 headings from each result.
Step 6: Save the Results
The script will save the DataFrame to a CSV file named “[keyword]_[country]_headings.csv“.
A download link for the CSV file will be provided. Or, it will start downloading your CSV file automatically.
Step 7: Export to Google Sheet
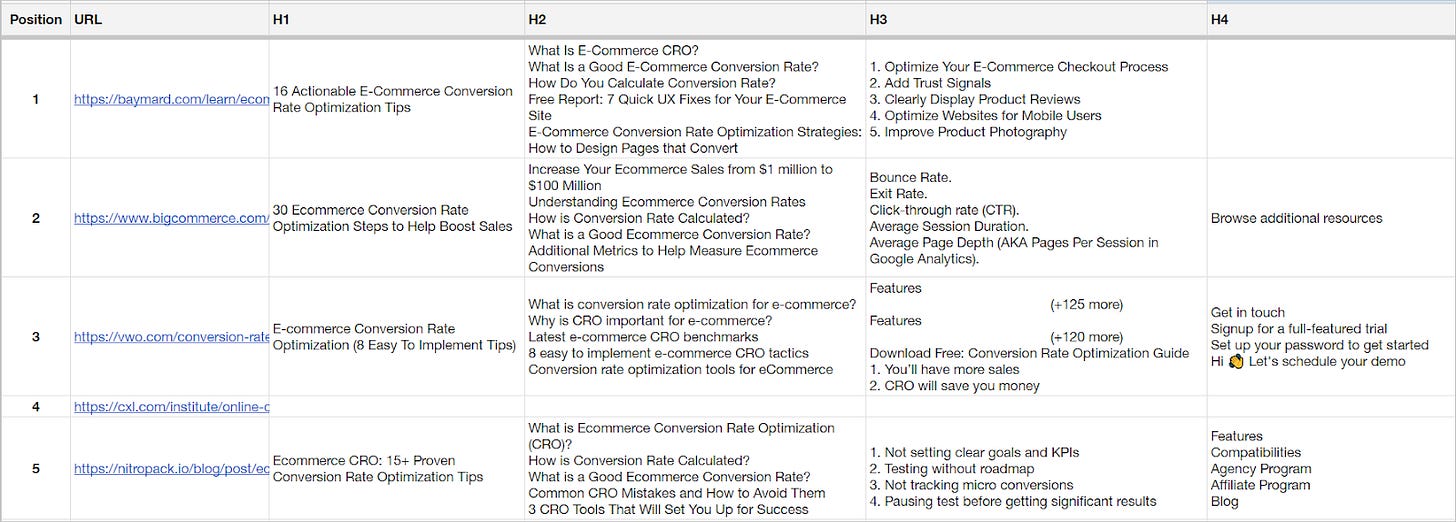
To analyze the data better, I’d recommend importing the CSV file into a Google Sheet and checking the headings used by top-ranking pages.
Here’s a sample data:
Use case
The extracted headings can be used for content analysis and creation:
Identify key topics and themes covered by top-ranking pages.
Create content outlines that align with SEO intent.
Improve your information gain by following a more detailed structure than top pages.
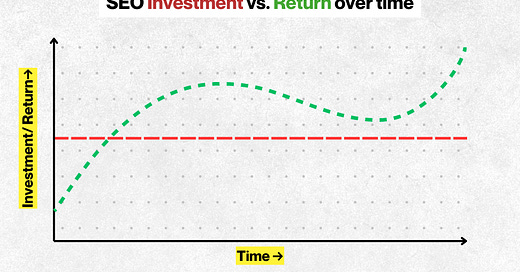
2. Show this illustration to your next SEO client meeting and win their trust
Proposing your SEO services to your prospects?
Then, attach the below image in your SEO proposal or show them this visual in the next meeting to explain:
How the compounding growth happens in SEO
SHOW this image to your clients to explain how SEO investment pays off over time.
Explanation:
Initial investment period: The green line starts below the red, indicating that returns are lower than investments at first.
Break-even point: Where the green line crosses above the red, showing when SEO efforts start paying off.
Growth phase: A significant period where returns substantially exceed investment.
Slight dip: Demonstrating that SEO results can fluctuate due to algorithm changes or competition.
Long-term growth: The final upward trend shows continued increasing returns over time.
More visualization 📈, less theory 🗣.
Let's make SEO the biggest growth engine for your brand.
We started Accrue SERP with one clear goal— making SEO an outcome-based marketing channel (leads, signups, & conversions) rather than chasing site traffic that doesn’t add any business value to your bottom line.
Let’s schedule a 15 to 30-minute meeting to understand how we can help you achieve business growth with our outcome-based SEO services in India.
Let’s connect on LinkedIn.


